Checkout without the surprises
A research-led redesign of the cart-to-payment flow for a furniture and home marketplace with 4M+ users. It found the real cause of drop-off, silent changes when the address changed, and lifted order completion by 18%.
Before
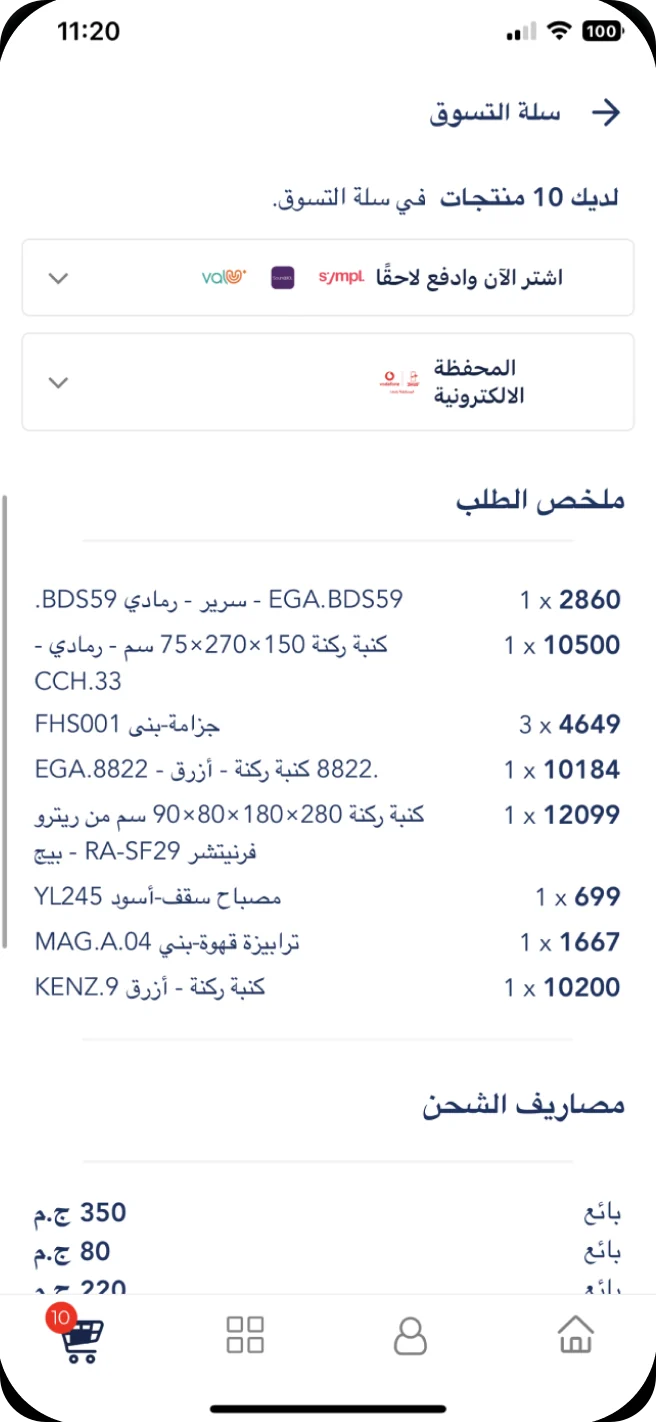
SKU codes, and fees listed apart from the products
After
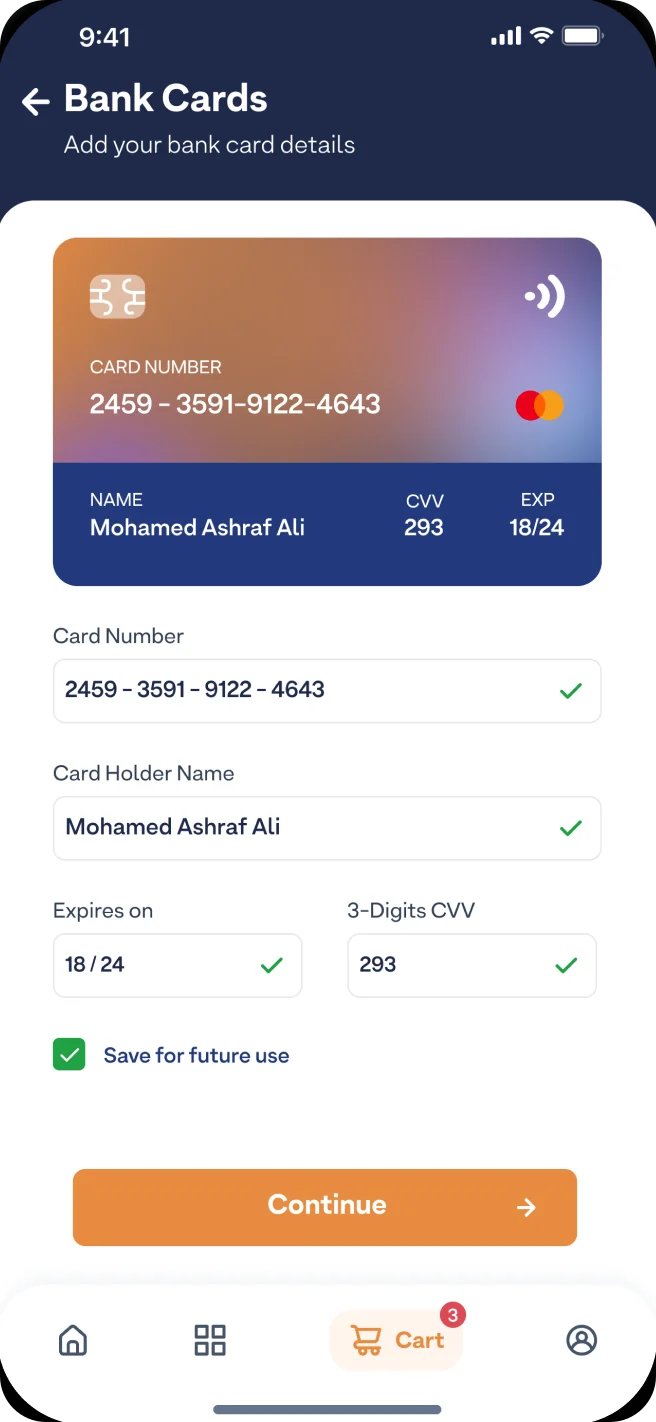
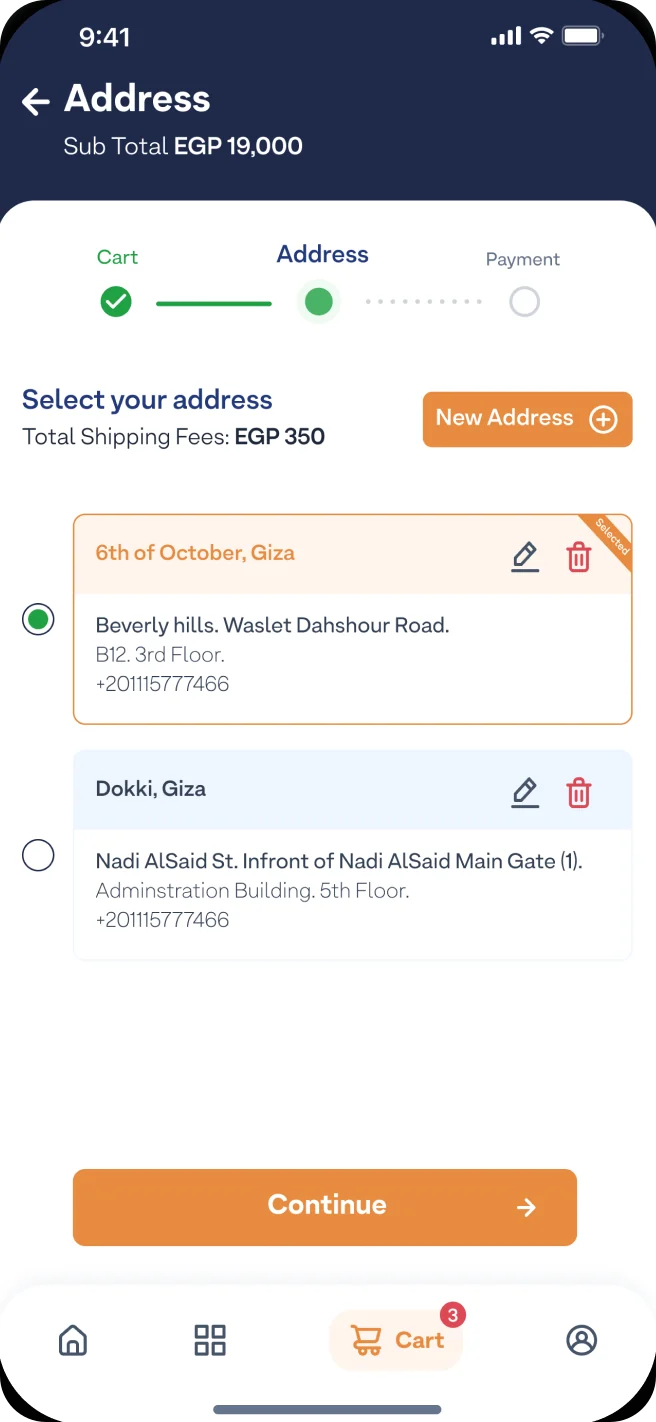
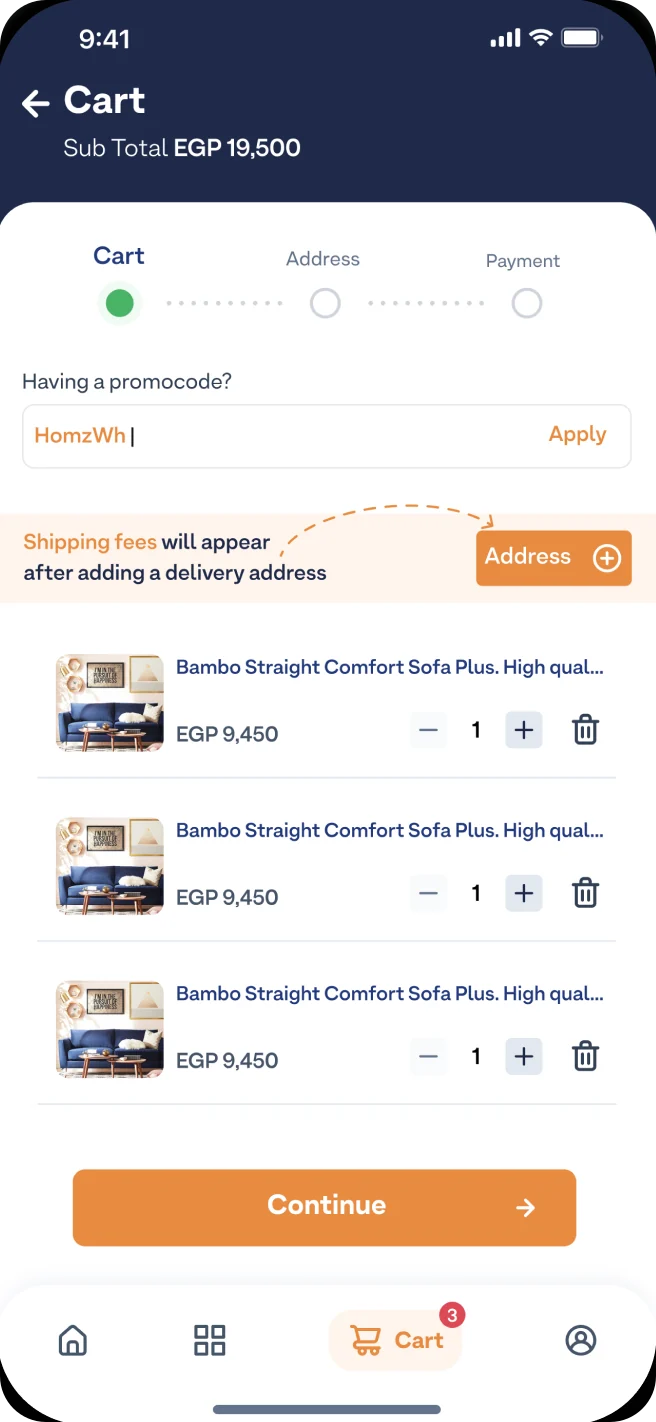
Cart to payment, before and after
The challenge
Shoppers were filling their carts and leaving before they paid. The marketplace sells furniture and appliances, where baskets are big, delivery depends on where you live and trust decides the sale, so every abandoned checkout was expensive.
Problem
High drop-off between cart and payment, and a steady stream of support contacts from people unsure what had happened to their order.
Goal
Find out why people left, fix the cause rather than the symptoms, and make every step of checkout explain itself.



“I’m looking for good quality furniture or appliances at a fair price, with fast delivery and a simple, hassle-free buying and return experience.”
Research
01 Who we were designing for
I started in Google Analytics and Looker Studio, looking at age, device, browser and where visits came from. It grounded the persona in real data and let me recruit ten interviewees who reflected the actual user base.
people used the marketplace in the first half of 2021. This is who the persona and the interview group were drawn from.
- Men 52%
- Women 48%
are between 25 and 44.
shop on a mobile device, mostly Android.
- Android 55%
- iOS 36%
- Other 9%
arrive inside another app’s built-in browser.
of visits come from Facebook and Google ads.
of mobile users are on an iPhone. The rest is spread across Android brands.
Google Analytics, 1 January to 7 July 2021. Age and gender cover the share of users Google could classify.
02 What they told us
Ten interviews, run with product managers, focused on checkout but open to the whole experience. We clustered what we heard into how people felt, what they wanted and what frustrated them.
How they felt 4 notes
- I don’t really feel secure or comfortable with your checkout process.Participant 4
- I hate your app’s crash notifications. I don’t understand what to do next to solve the issue.Participant 4
- Your app is a bit outdated, old school in its interface design. I think you have some issues with typography.Participant 1
- You spam me with notifications every day. I turned your push notifications off, by the way.Participant 5
What they wanted 3 notes
- I want to track my order in the app rather than always contacting support to know its status.Participant 3
- Please add order tracking.Participant 4
- Why doesn’t the app take my location first, then show only the products it can deliver to me?Participant 1
What frustrated them 3 notes
- Sometimes the app crashes and updates my products.Participant 5
- I can’t relate the shipping fees to which products.Participant 5
- The website experience is much better than your app.Participant 4
03 What was really going wrong
The core issue turned out to be in the backend logic, and the interface made it worse by staying quiet about it.
-
Silent changes
Changing location or adding an address during checkout could update availability, or mark items as out of delivery range, without telling anyone.
Delivery location comes first, and every cart item shows its status.
-
Unclear shipping fees
People couldn’t relate shipping fees to the products they applied to, which added doubt right before paying.
Fees appear with the address they belong to, and in a full summary before payment.
-
No feedback
Changes happened in the background without explanation, so people didn’t know what had changed, or where their order was.
Three visible steps, a clear confirmation and order tracking.
Designing the flow
04 Wireframes, one state at a time
Before any visual design, I wireframed the whole flow around those three findings: cart, address and payment as explicit steps, with a screen for every state the backend could produce.
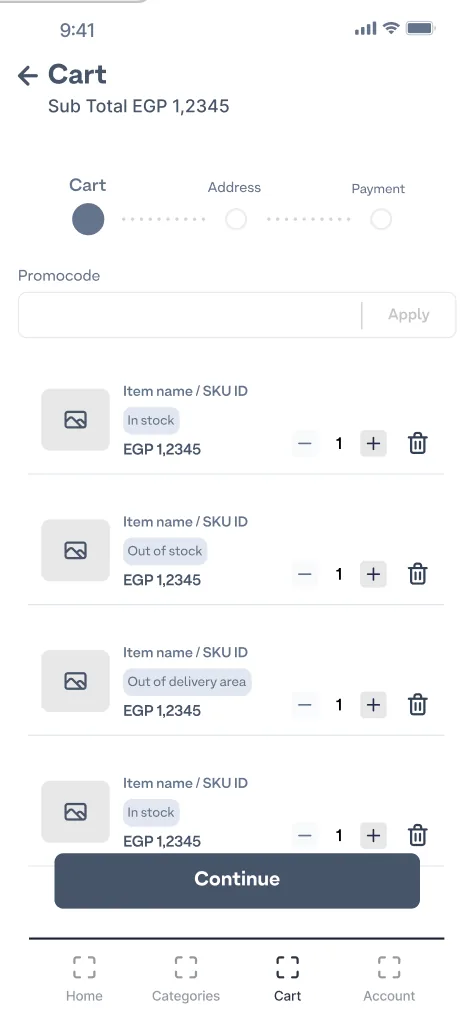 01Every item shows its stock or delivery status.
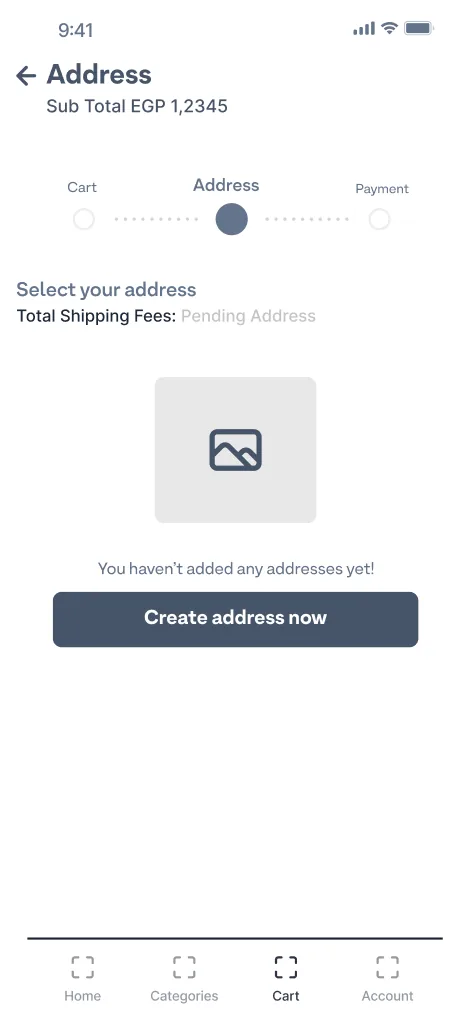 02Shipping stays pending until there’s an address.
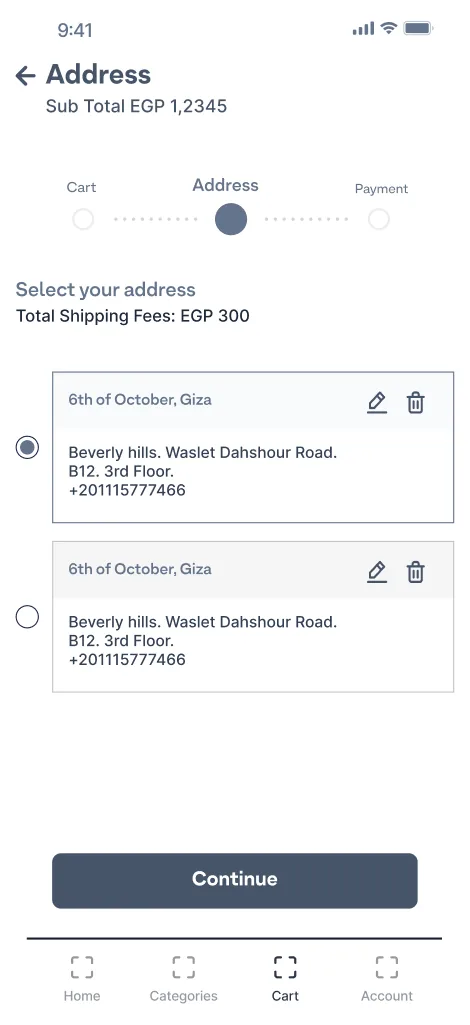 03Fees update with the chosen address.
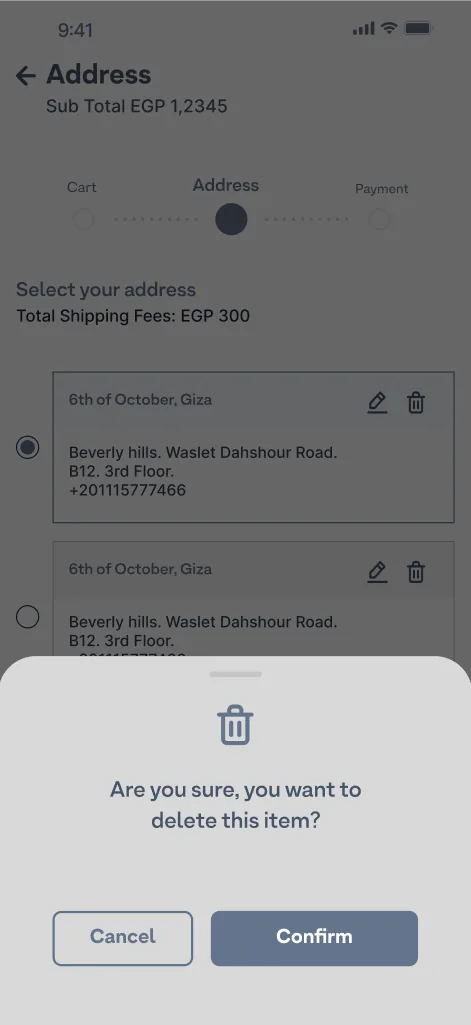 04Destructive actions confirm first.
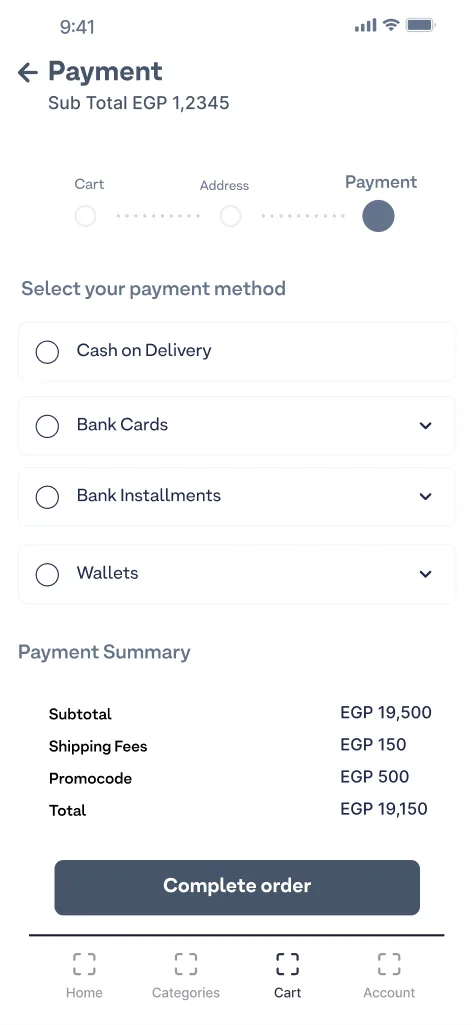 05Methods grouped, with a full summary.
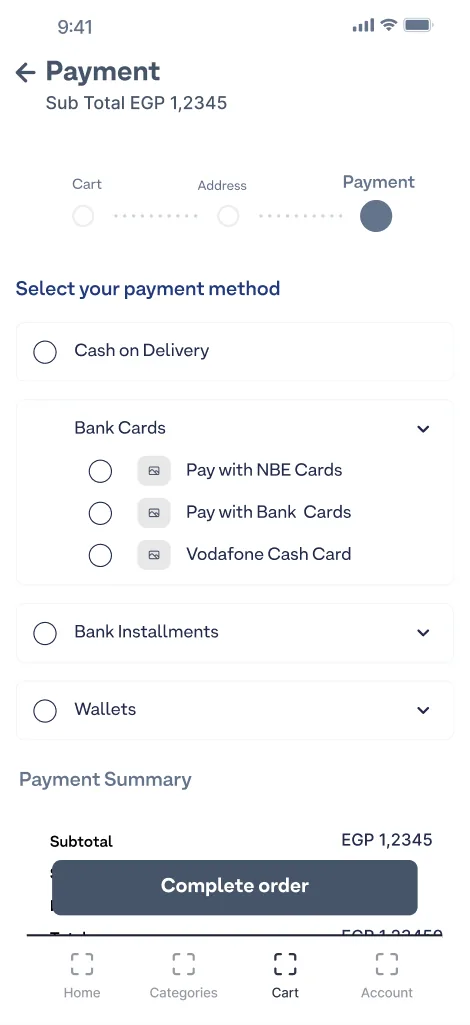 06Options expand in place.
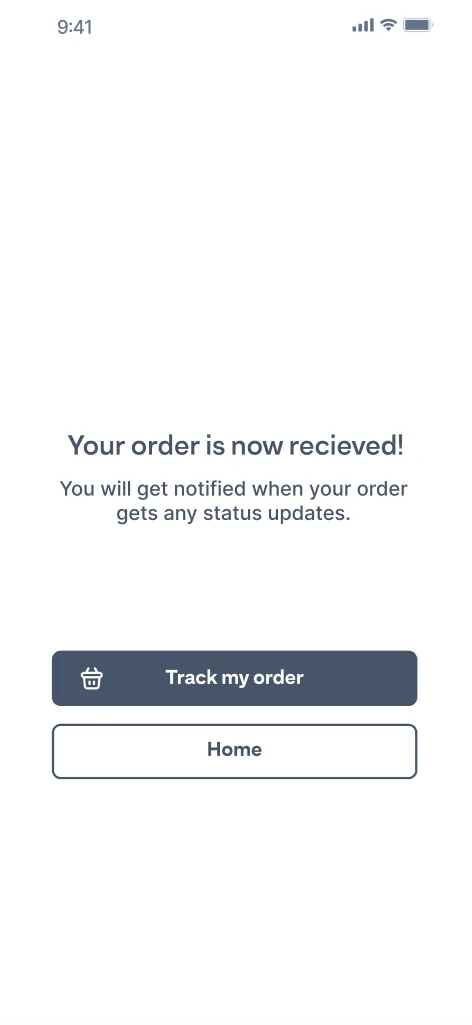 07A clear next step: track the order.
05 The final mobile flow
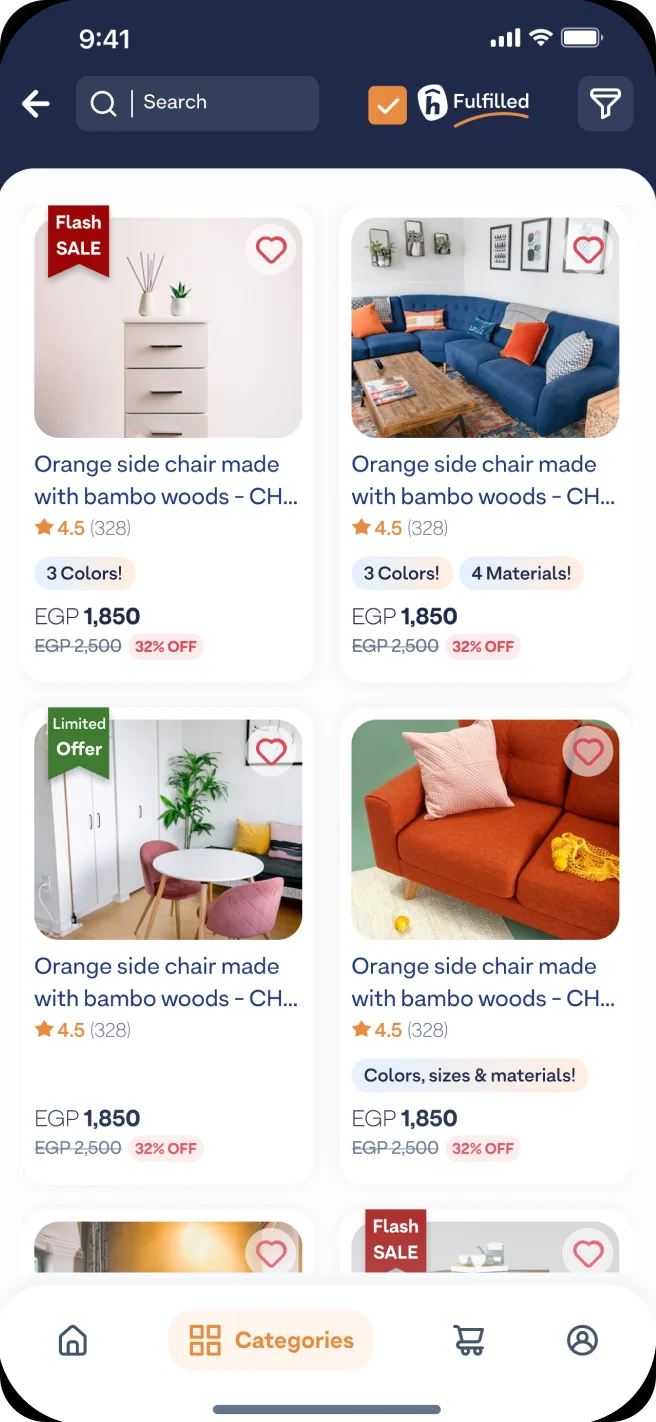
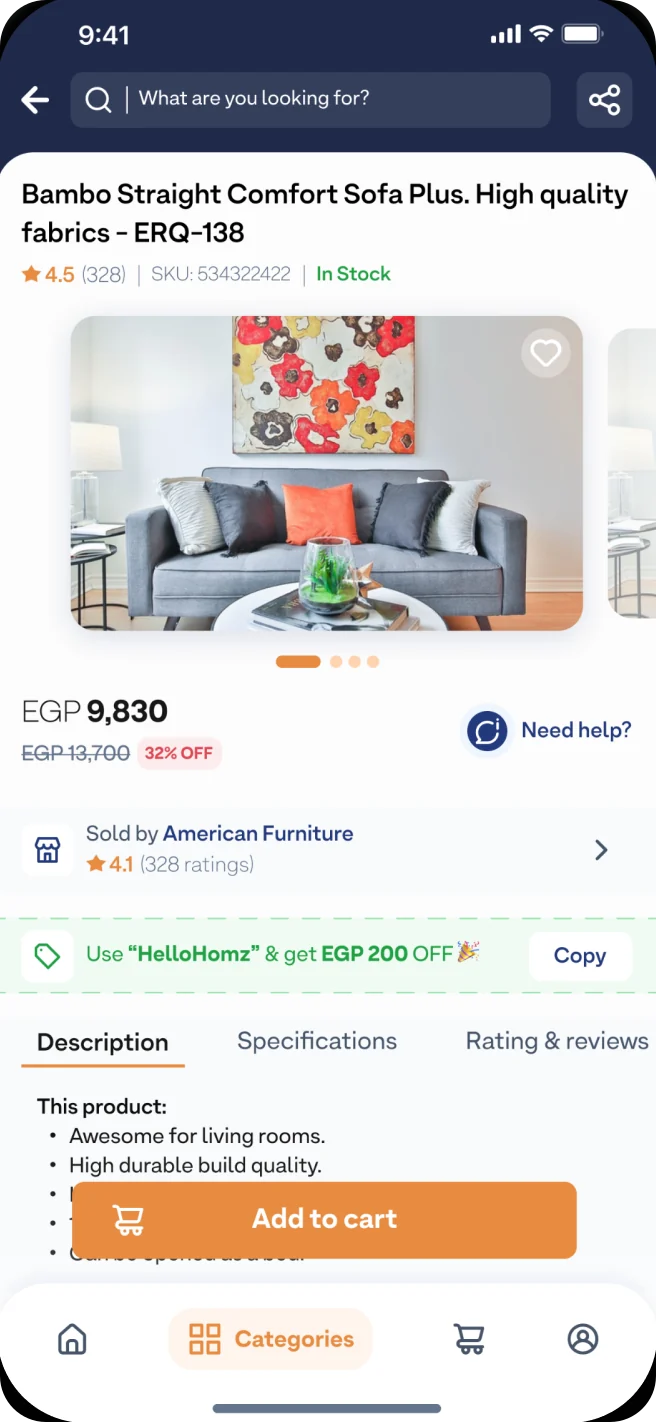
From home to payment, every screen answers the question the old flow left open: can this reach me, what will it cost, and what happens next.
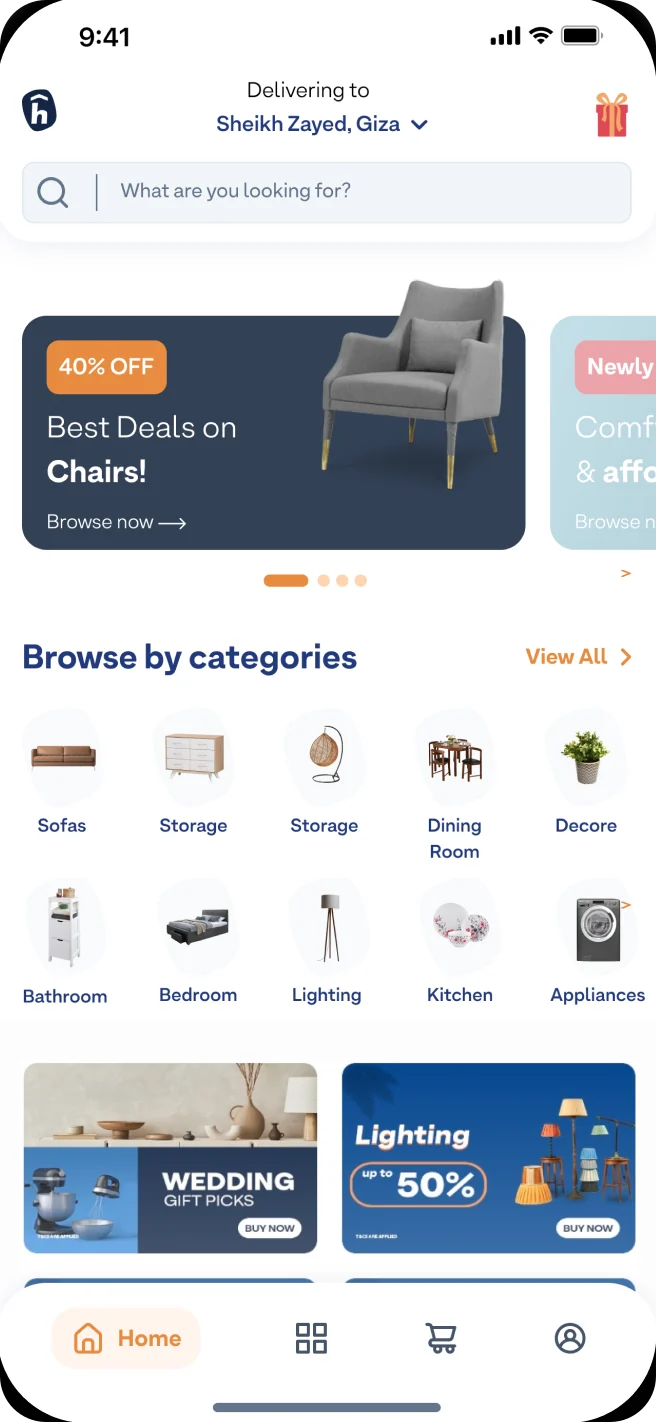 Click to enlarge
 Click to enlarge
 Click to enlarge
Click to enlarge
Click to enlarge
Click to enlarge
Click to enlarge
Click to enlarge
Click to enlarge
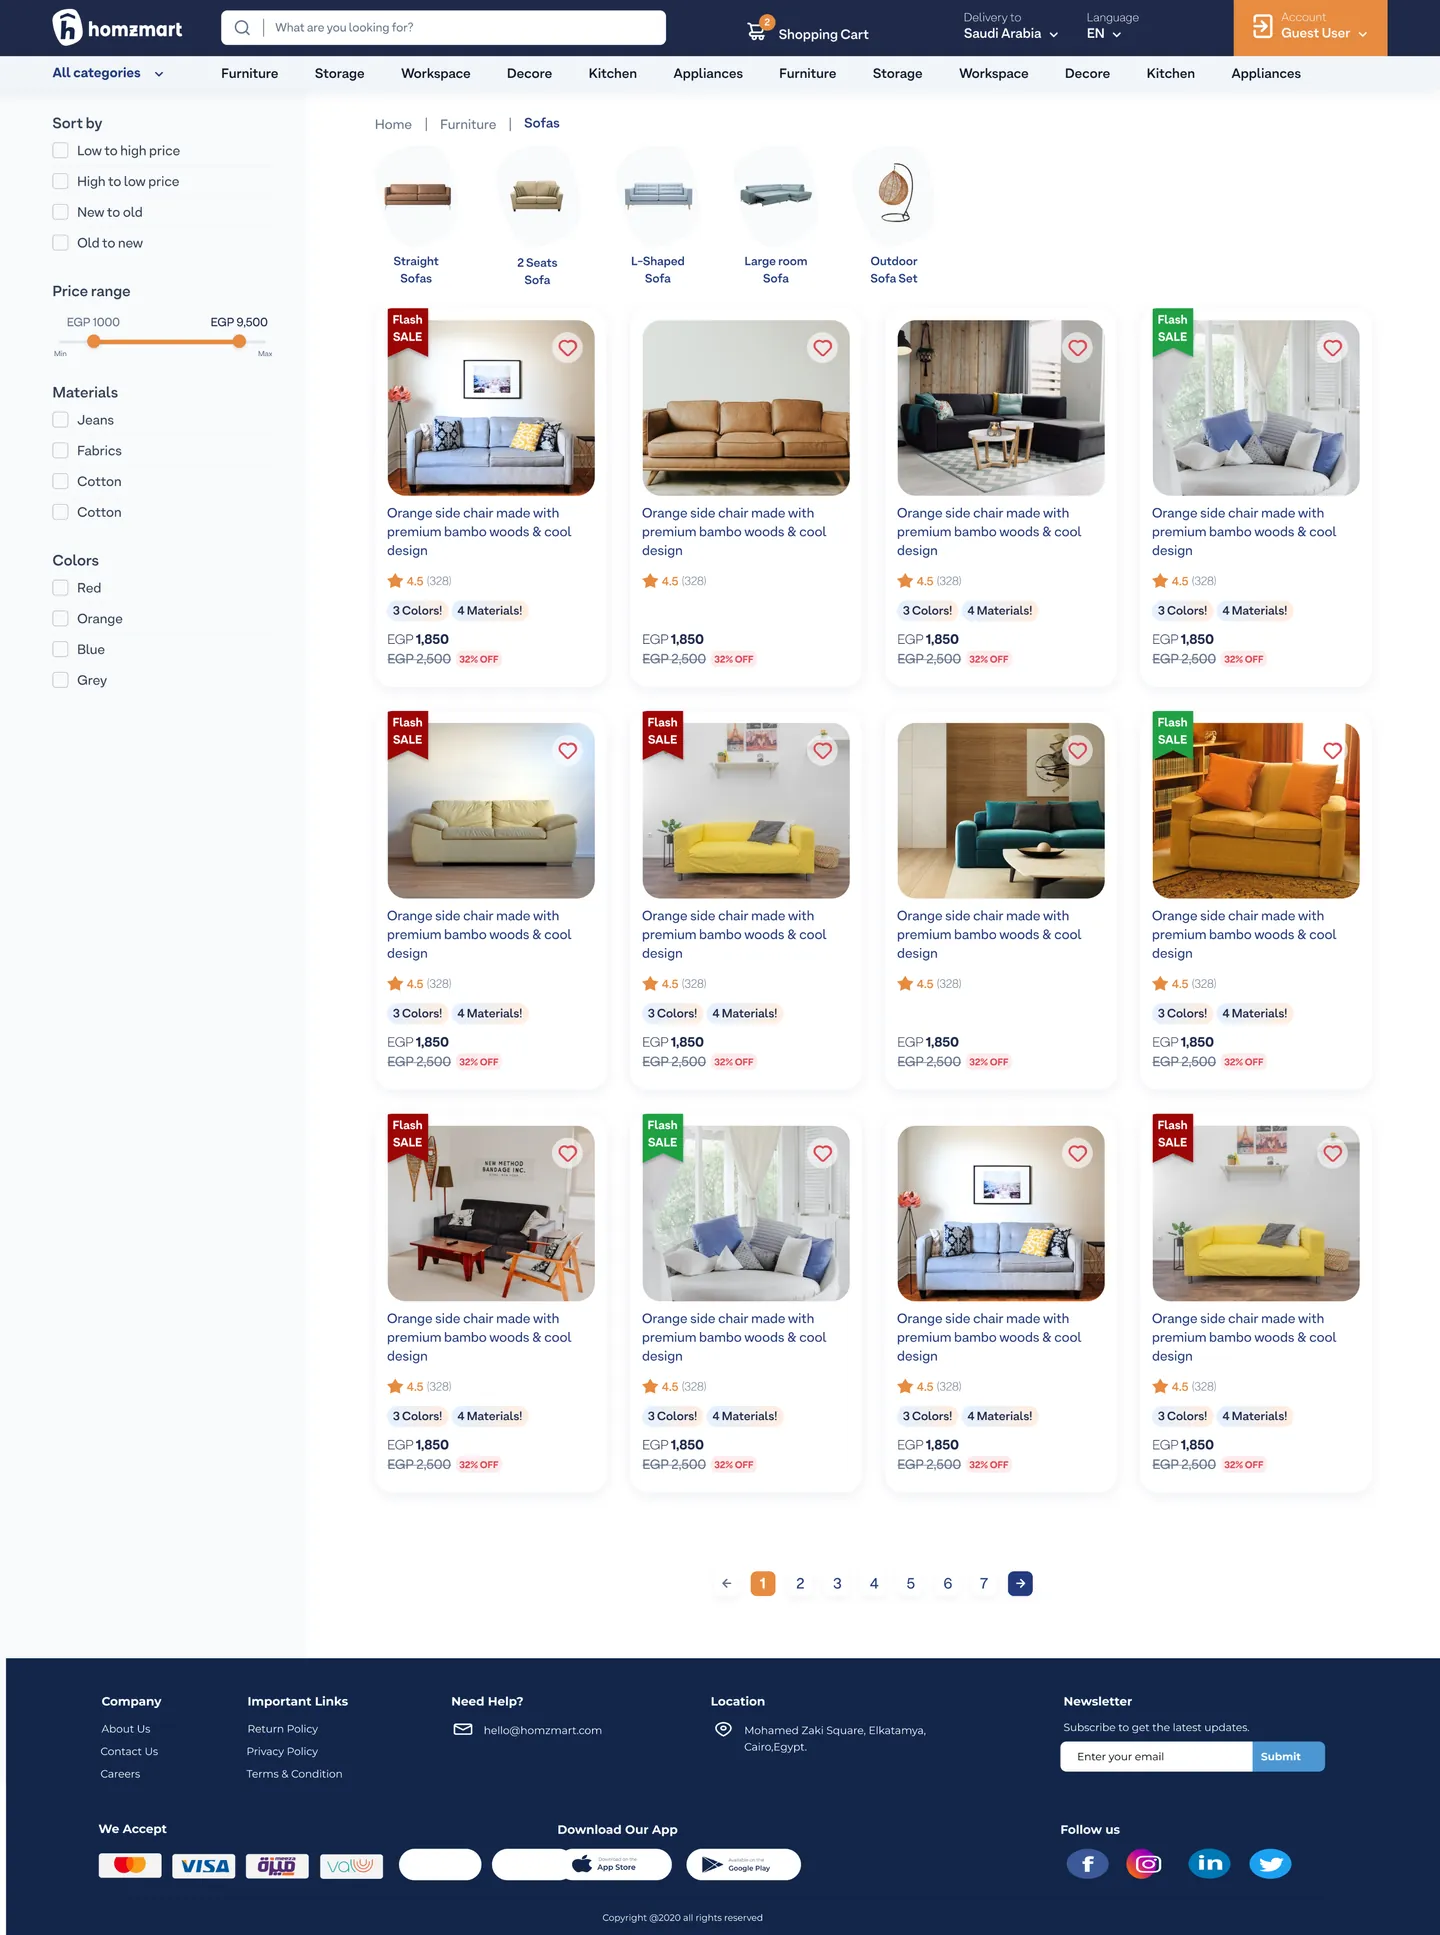
06 The same thinking on the web
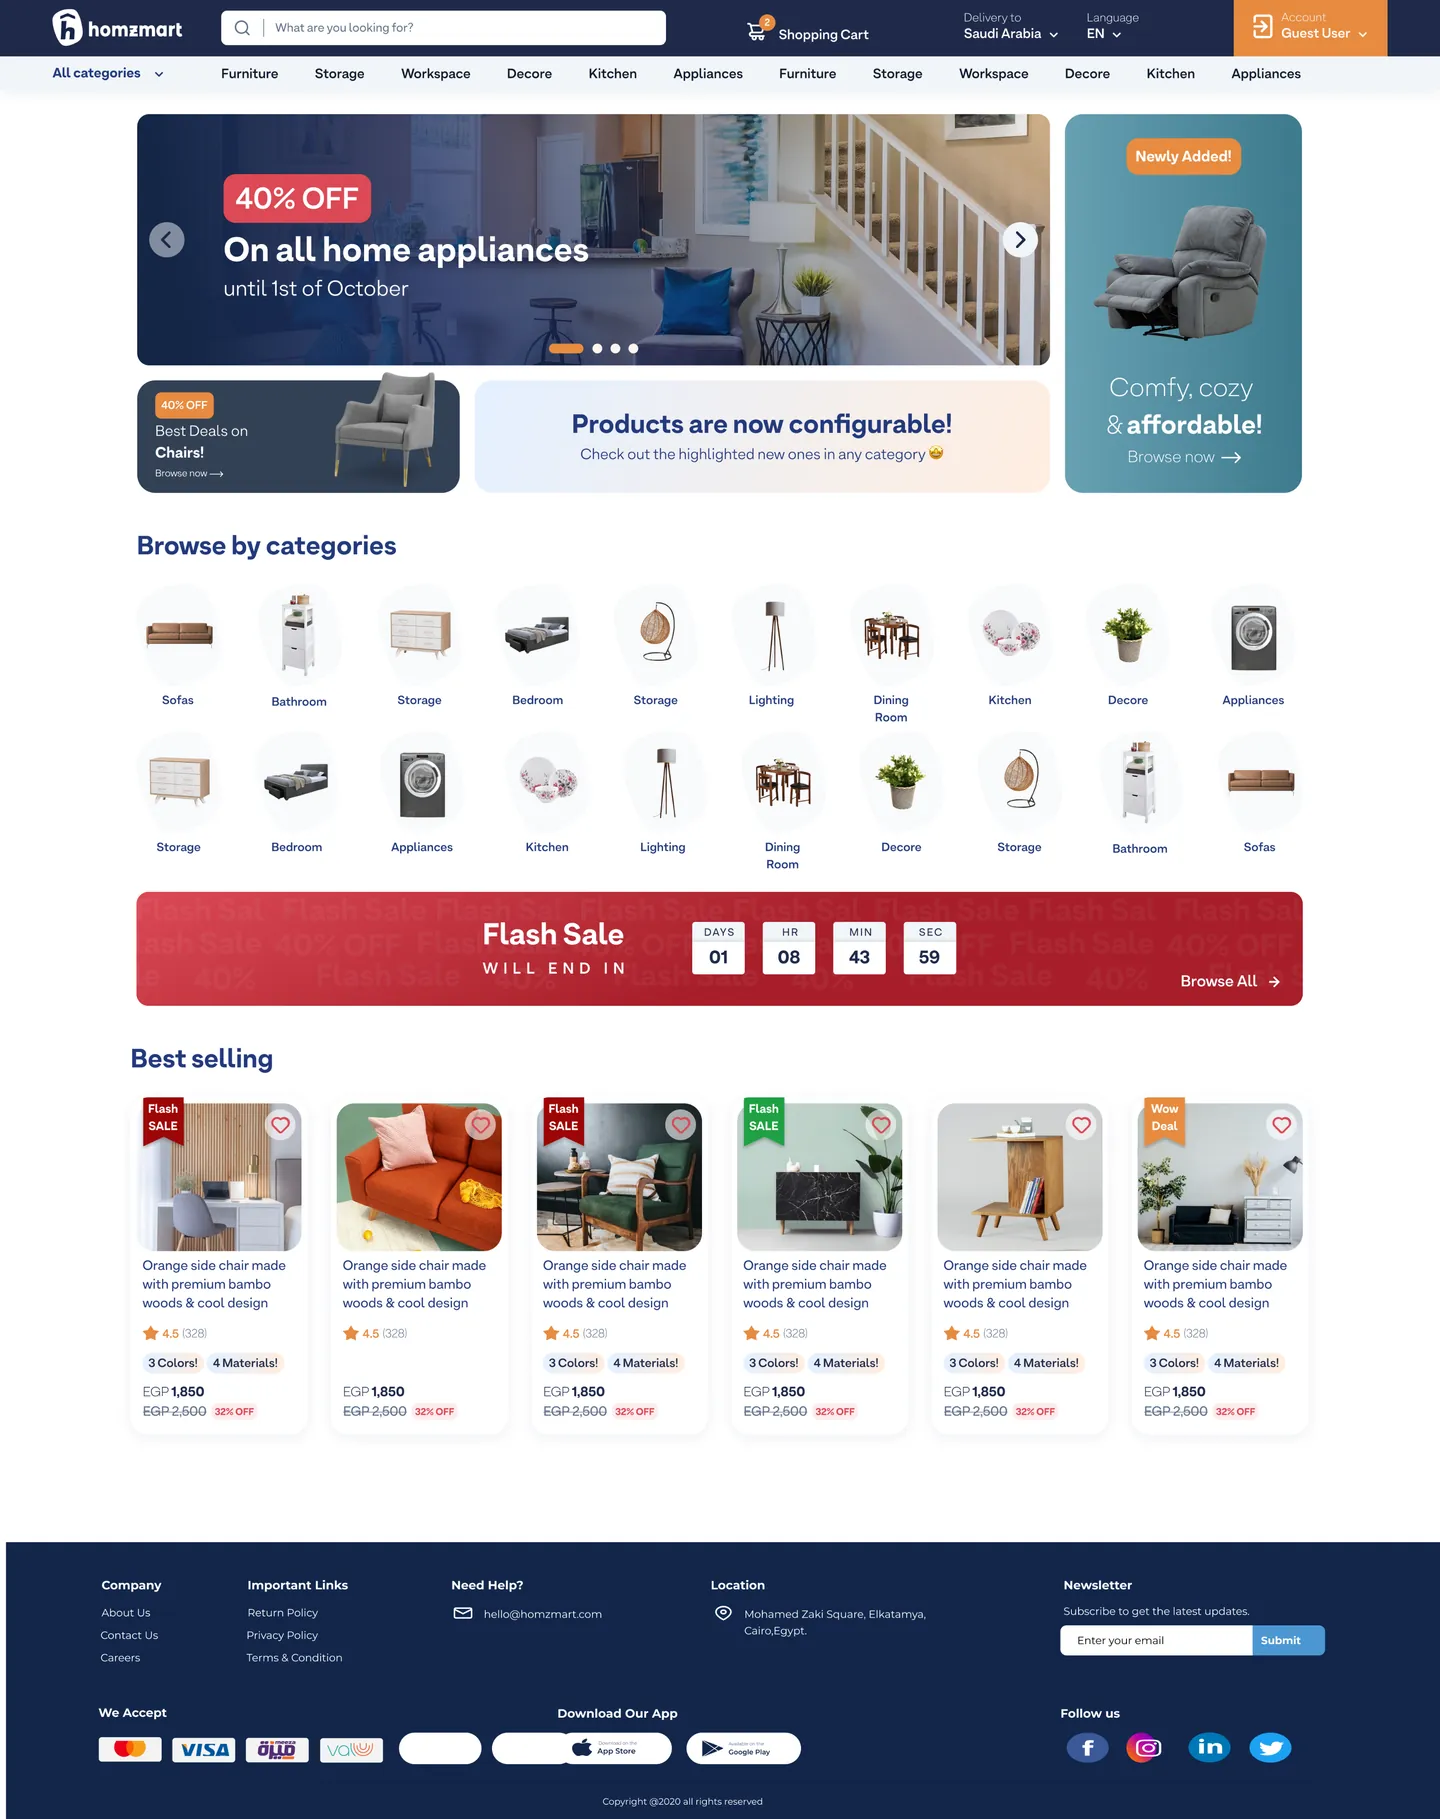
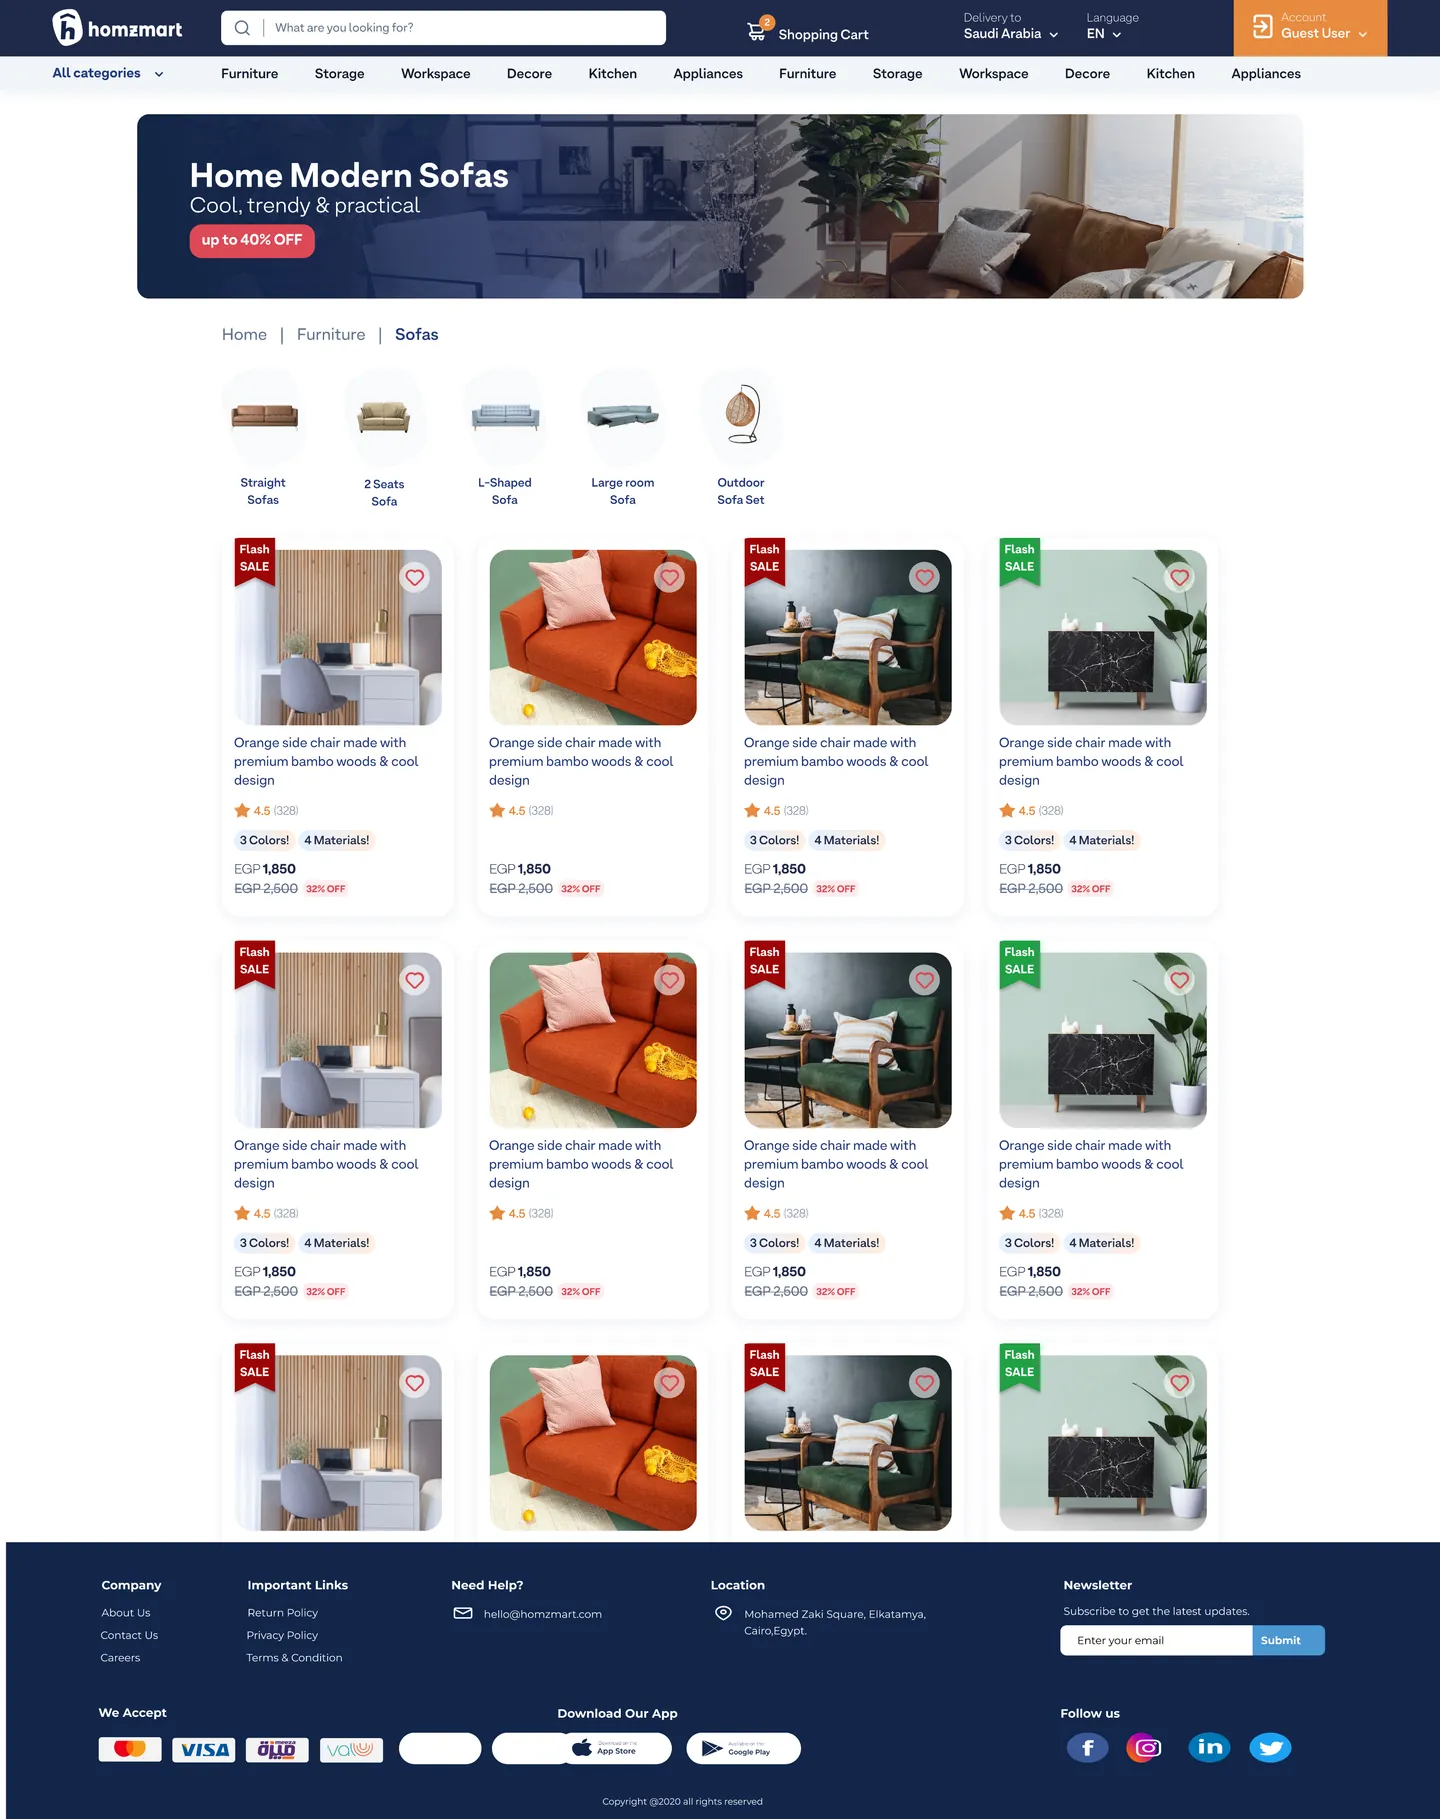
The website follows the same rules: delivery location in the header, categories up front, and product cards that show offers and variants before you click.
Impact
Every UI change is coupled with UX impact
What the team tracked after the redesign shipped, and the design decisions behind each number.Hover a number to see what moved it
- 4M+Impacted users
What moved it
Every order placed on the app goes through this flow.
- Cart, address and payment redesigned end to end
- The same thinking carried to the website
- Patterns that stayed in the product until 2026
- +18%Order completion rate
What moved it
More of the people who reached the cart finished the order.
- Delivery location set before browsing
- Stock and delivery status on every cart item
- Three explicit steps: cart, address, payment
- −19%Time to complete order
What moved it
Fewer detours between cart and payment.
- Saved addresses, with fees shown on selection
- Promo code applied in the cart
- Payment methods that expand in place
- +8%Average basket size
What moved it
Clearer offers made one more item an easier decision.
- Discounts and promo codes on the product page
- Colours, sizes and materials shown in listings
- Categories one tap from home
- −13%CX inbounds about checkout
What moved it
Fewer people contacting support to ask what happened.
- Changes explained instead of applied silently
- Shipping fees explained before payment
- Order confirmation with tracking
- +21%Customer satisfaction
What moved it
Checkout stopped feeling risky.
- A modern, consistent visual language
- Clear feedback at every step
- Card details validated field by field
What I took away
What I value most is that many of these improvements lived on in the product for years. Work I contributed in 2022 was still shaping the experience in 2026.
- 01
Use both kinds of research
Analytics told me who to talk to. Interviews told me why they left. Neither would have found the backend cause on its own.
- 02
Small decisions, at scale
On a platform with over 4M users, even small UX decisions have a noticeable effect on conversion and trust.
- 03
Learn the domain’s patterns
The project deepened my understanding of marketplace and e-commerce patterns, and of how people decide when they shop online.